by Evan J. Smith

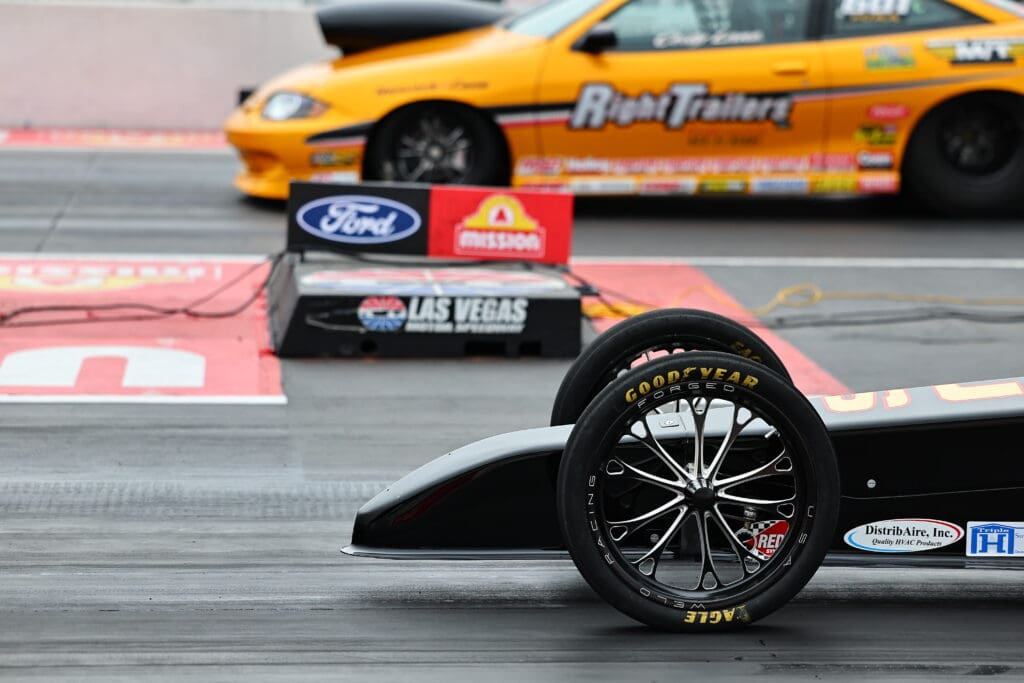
Racers are always looking for a competitive edge, you know, something that gets them to the winner’s circle. The typical drag race takes just a few seconds, and as we know, there’s little room for error. Both human and mechanical performance are critical, and successful racers understand how to maximize both at the most opportune time.
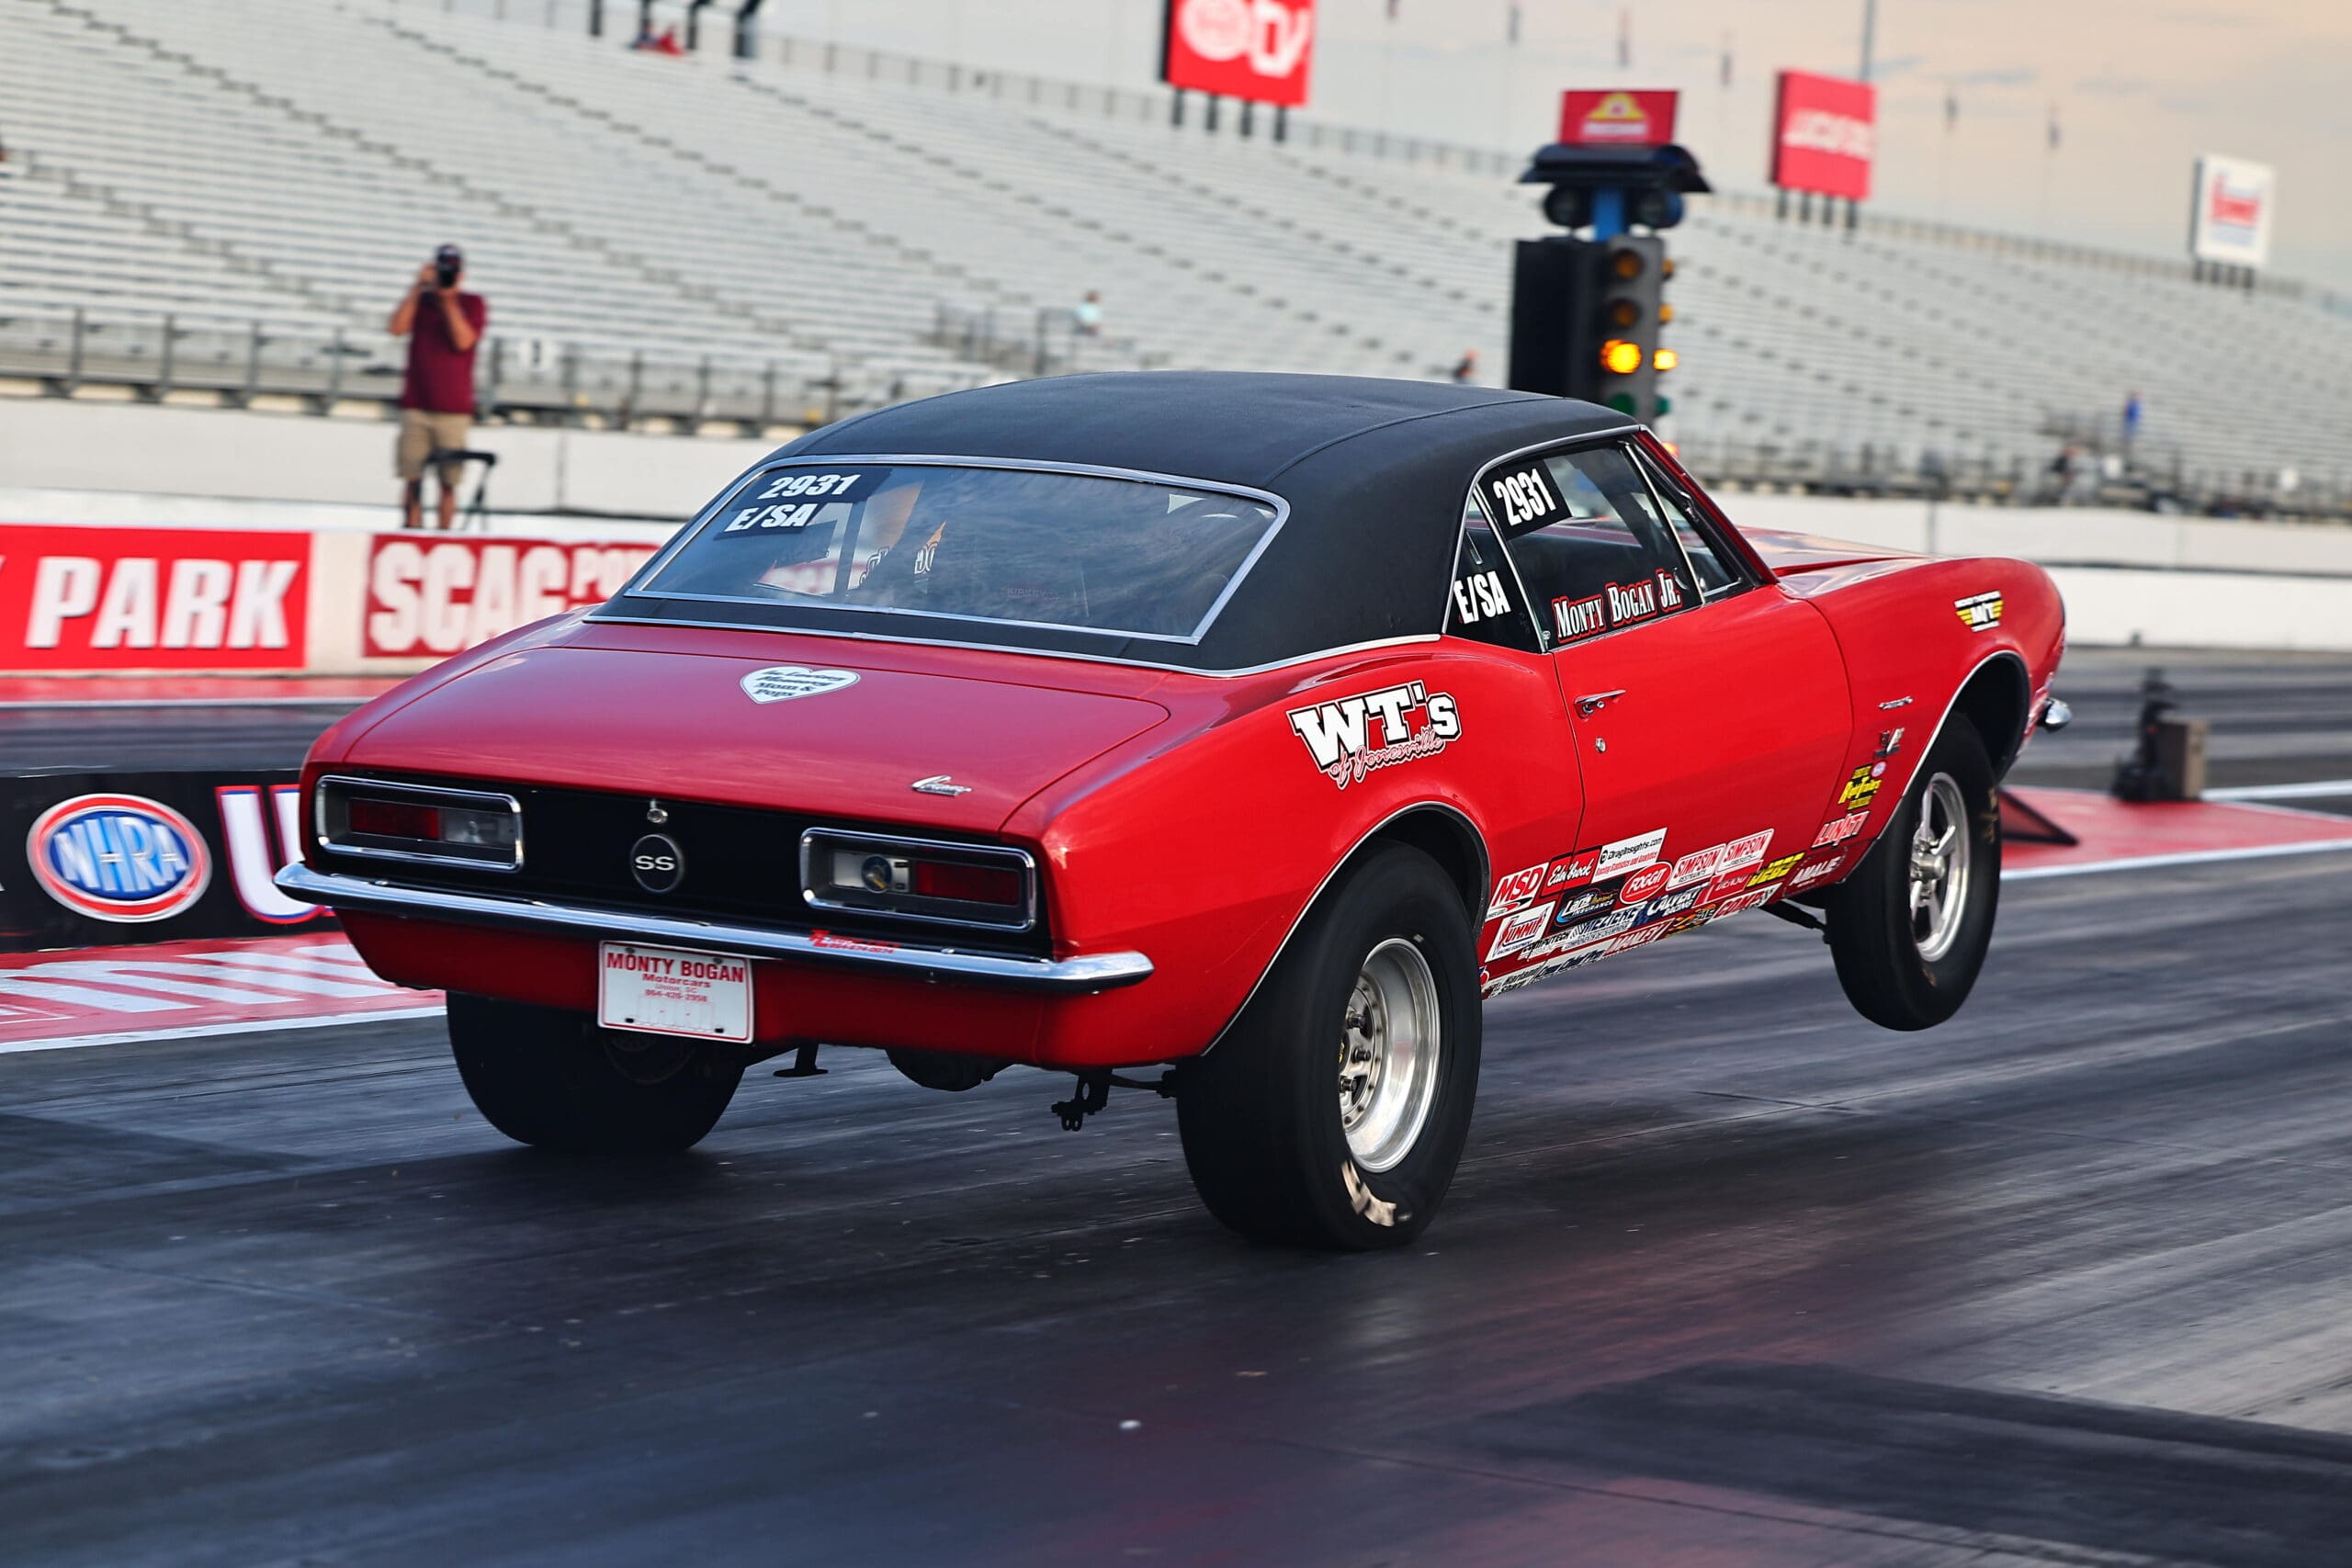
For a few seasons now, NHRA sportsman racers have been using the DragInsights app (draginsights.com) as a tool for statistics and analytics. The app is packed with useful information on every sportsman driver from Super Street to Comp and there’s a free version and a premium option that costs a mere $79 per year and unlocks more features.
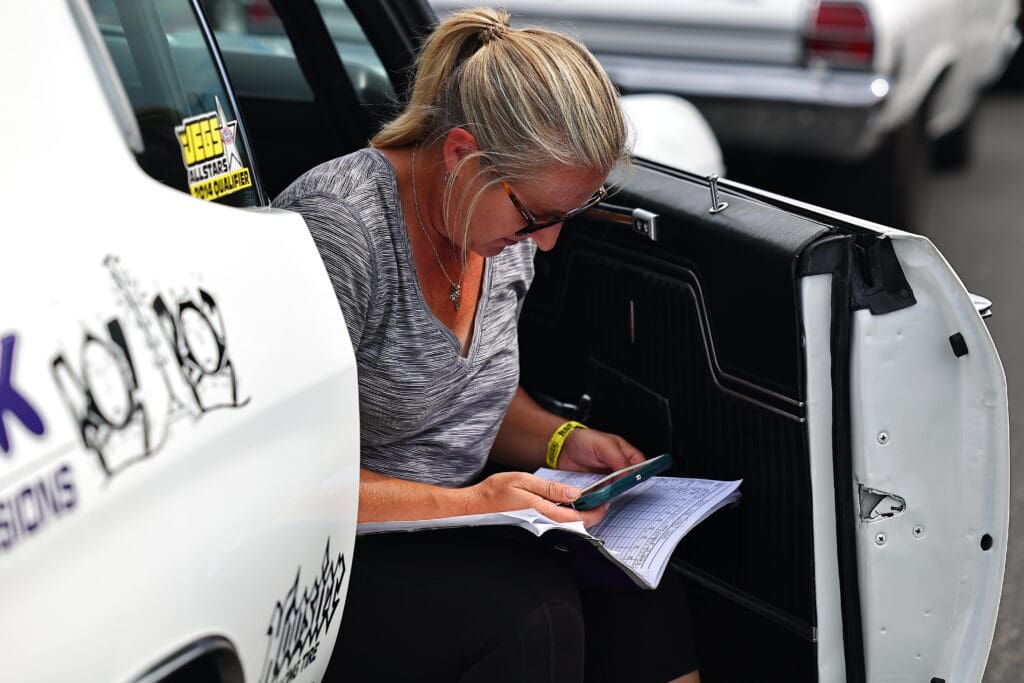
No matter your class of competition, success will come from confidence in your vehicle and in your abilities. This means having a plan to execute and the ability to call an audible if needed. The mental side of racing comes from experience and good racing practices and one practice is learning to analyze the data from each run. This includes timeslips, weather data and any data logging. It can also come from personal performance, such as how consistently you staged and drove the car.
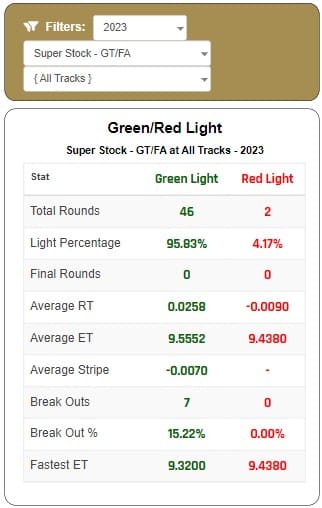
With DragInsights, drag racers, crew members and fans gain access a large database of nearly 10,000 drivers. With the swipe on your computer or smartphone, you’ll see personal and competitor data points, statistics, and analytics. This includes info such as reaction time average, win/loss percentage, green vs red lights, rounds won, average elapsed time, average dial in, average mph, average margin of victory, breakouts and more.
“With DragInsights you’ll see a fuller picture of where you stand and where your opportunities are to improve,” said Alicia Anderson, creator of DragInsights. “With race statistics for over 9,000 drivers and hundreds of events, it’s the very source that breaks down key pieces of your performance from many different angles to help you strategize for every event and every round or racing and qualifying. But more than just stored data, DragInsights will help you unlock the complexities of drag racing. It’s one thing to look at stats, it’s another thing entirely to use the data in a positive manner. With DragInsights you’ll rely on solid data, and you can track your progress, and you go,” she added.
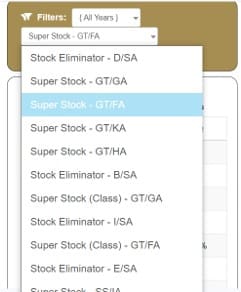
Here’s an interesting fact: the top Super Stock racers (based on points) keep red lights to around 5-10 percent of total rounds, and armed with that info, you can compare your performance. You can also use the DragInsights filters to look at different classes you run—and even at different tracks—to understand why you might be reacting differently in different situations.
There’s even data on Lane Choice. Most drivers have a preferred lane, but DragInsights lets you use the statistics to confirm if you are performing better in that “preferred” lane, or is it just perception? Most importantly, when you line up against a competitor, what is his or her better lane, i.e., where do they win more? Being armed with the data gives YOU the advantage.
Does this interest you? If so, join at www.DragInsights.com.




















THE TEN – 2025 YEAR-END EDITION