


AEM'S NEW DATA ANALYSIS SOFTWARE
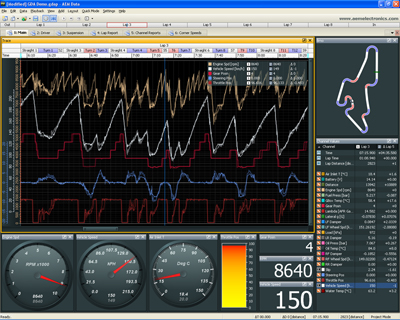 AEM’s new AEMdata data analysis software is a custom data analysis package for select AEM products that features advanced 3D graphics and a user-friendly interface. It allows the user to review and playback vehicle, driver or engine data and overlay this data using charts, dash displays, gauges, or custom displays that you create. High-speed logging is saved to a file internally or via PC connection.
AEMdata FEATURES:
Multi-tabbed, customizable workspace
Drag and drop channel selection
Smart data organization
User-defined math channels
Channel statistics include min/max values, start/end vales, time at start/end of range, time at sample min/max distance at start/end of range, min/max distance samples and more!
User-defined reports
Log playback mode
Circuit or stage modes
Multi-lane log trace
Multiple channels per lane
Track mapping is available via VSS and G Analyst or with GPS in closed circuit or point-to-point
Unlimited map overlays
Lap/sector analysis
Time/distance plots
Alarm reports
Analog-style and bar gauges
X/Y plots
Histograms
3D scatter plot
Data export via .csv, Matlab, etc.
For more information, visit www.aemelectronics.com
{source}
<div style="float:left; padding:5px;"><script type="text/javascript">
google_ad_client = "pub-8044869477733334";
/* 300x250, created 4/3/09 */
google_ad_slot = "2028912167";
google_ad_width = 300;
google_ad_height = 250;
</script>
<script src="http://pagead2.googlesyndication.com/pagead/show_ads.js" type="text/javascript"></script>
</div><div style="padding:5px;">
<script type="text/javascript">
 sr_adspace_id = 2000000613807;sr_adspace_width = 300;sr_adspace_height = 250;sr_ad_new_window = true;sr_adspace_type = "graphic";
</script>
<script type="text/javascript" src="http://ad.afy11.net/srad.js?azId=2000000613807">
</script></div>
{/source}